
Effects of "Urbanness" on land surface phenology
SUMMARY: Impacts of increasing urbanization and land cover fragmentation include regional climate change, changes in forest health, increased risk of invasive species, and shifts in phenology (areas with similar climates and timing of biological events). Phenological progress milestones, such as start of season and end of season, are sensitive to change, and are therefore excellent indicators of changes in climate, forest health, and gross primary production. Researchers are studying urban climate drivers and their effects on land surface phenology variation to determine if urban density or “Urbanness” affects specific aspects of forest vegetation timing and development. Results of this study may yield urban index thresholds which could be used by urban planners to avoid altering the development of urban forest vegetation.
EFETAC's ROLE: The project is being performed by Eastern Threat Center scientists.
STATUS: Completed
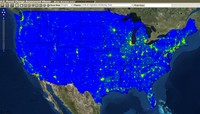
PROGRESS: Researchers have combined fine-scaled population data modeled from the U.S. Census with the density of impervious surfaces (such as paved areas and buildings) to develop a continuous, quantitative national Urbanness Index map. This Urbanness Index conceptually treats cities as a continuous gradient, from the heart of the downtown of the largest city to the most rural place that is farthest from any road. The Urbanness Index provides a relative index value to all cities, towns, and rural areas in the conterminous United States. These Urbanness Index values can be used to rank all U.S. cities and towns in a uniform way across the country.
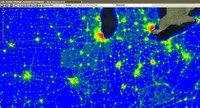
Eastern Threat Center scientists have divided the Urbanness Index map into nine discrete levels of urban density. Cities appear as an irregularly shaped “bulls-eye” target when shown in this nine-level map, in which the city center has a higher Urbanness Index ranking, decreasing as one travels away from the city center toward the suburbs and exurbs. The outermost rings of the bulls-eye reach out along roadways, nearly joining with adjacent cities and towns. The size of the city can be judged by the magnitude of the innermost ring of the target, the bulls-eye, since the urban density of the downtown business district is related to the size of the city.
Researchers have also created a series of seven maps that isolate all of the cities in the lower 48 United States within each of the top seven Urbanness levels. Thus, Size 8 cities are those that culminate in (but do not exceed) an area of Urbanness Level 8 at their centers. These city size class maps can be used as urban "masks" within a Geographic Information System (GIS) to distinguish between and locate the extents of cities having different urban densities, and will be used to examine the effects of increasing urbanness levels on several aspects of forest phenology, including start of spring and fall, end of spring and fall, and duration of the growing season.
Many of the Eastern Threat Center’s Urbanness maps can be viewed and interactively explored by anyone, using the online web-based Forest Change Assessment Viewer. Click the images below to access the viewer and explore the maps.
Urbanness across the contiguous United States:
Zooming in on some eastern cities, all nine levels become visible:
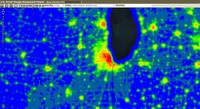
Urbanness levels of Chicago can be shown as an opaque raster (top) or as a set of transparent isopleths (contour lines) through which a satellite image can be seen (bottom):
“Twin” cities can be seen to have multiple Urbanness “bulls-eyes,” as expected:
Dallas/Fort Worth -- 1. as raster grid 2. as vector borders
Tampa/St. Petersburg -- 1. as raster grid 2. as vector borders
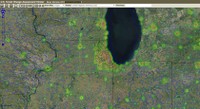
Minneapolis/St. Paul -- 1. as raster grid 2. as vector borders
Effects of the North-South-East-West grid of the Townships and Sections in the Public Land Survey System (PLSS) become evident in the central plains.
Individual cities of various sizes can be distinguished and mapped by specifying a particular Urbanness density level, and then showing only the Level 3 isopleths that surround cities whose centers attain that Urbanness Index level, but no higher. Thus, all cities in eastern North Carolina can be easily mapped. There are no Size 7 cities in North Carolina, although a large urban “complex” containing an urban corridor between Charlotte and Winston-Salem/Greensboro attains Size 8:
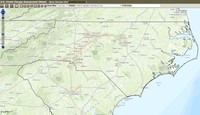
Asheville, Hickory, Fayetteville, Greenville, and the Raleigh-Durham Research Triangle are all part of the constellation of North Carolina Size 6 cities:
It is interesting that the Raleigh-Durham complex only reaches Level 6, even though the population of this fast-growing urban area would otherwise qualify it for a higher ranking. Presumably, the urban "sprawl" in this area dilutes the population and imperviousness density sufficiently to result in a lower Urbanness intensity ranking. Thus, the relationship between the total population of a city and its Urbanness Index could be a quantitative way to identify cities having significant levels of urban "sprawl."
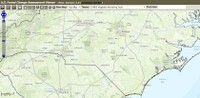
Level 3 towns can also be shown in North Carolina. These are distinct, spatially isolated rural centers that are not associated with larger cities:
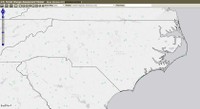
It is not possible to identify distinct towns at Level 2 or lower, since most cities join together into huge complexes at these levels. Urbanness Levels 2 and 1 are regarded as rural “background,” the backdrop for cities. Such rural areas can also be identified and mapped using these Eastern Threat Center products.
Not shown in the viewer is an additional map that shows the Size Level of the city or town to which every location in the map belongs. Thus, even locations on the outer fringes of large cities can be quickly identified as a part of a larger urban area. Feel free to explore the Eastern Threat Center’s Urbanness maps within your own city or hometown!
LINKS: National Phenology dataset
CONTACT: Bill Hargrove, Eastern Threat Center Research Ecologist, william.w.hargrove@usda.gov or (828) 257-4846
Updated June 2016
